How to Populate a Javascript Chart Dynamically from a SQL Database
Description
A Data Series can be used to dynamically populate a Javascript Chart control in a UX Component with data from a SQL Database.
Discussion
The data can be populated dynamically from a SQL Database. This is done by creating a Data Series and publishing it to the client. When you create the Data Series definition, check the Publish Data Series data to the client-side? checkbox. This will make all of the data available on the client for the Javascript Chart. This is important if you want the Data Series to be available in an offline environment.
Creating a Client-Side Data Series
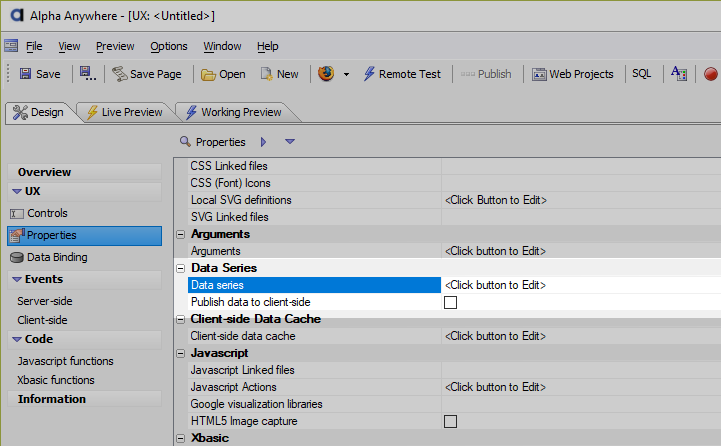
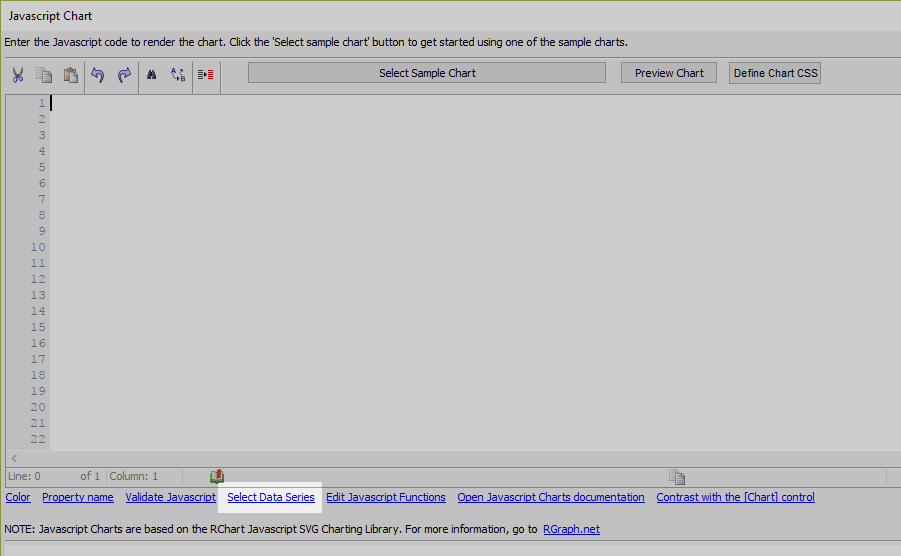
Before the Javascript Chart can be populated with data, a Data Series needs to be created. A Data Series can be created in the UX Component's properties (see the Data Series property) or when you are creating a Javascript Chart by clicking the Select Data Series link:
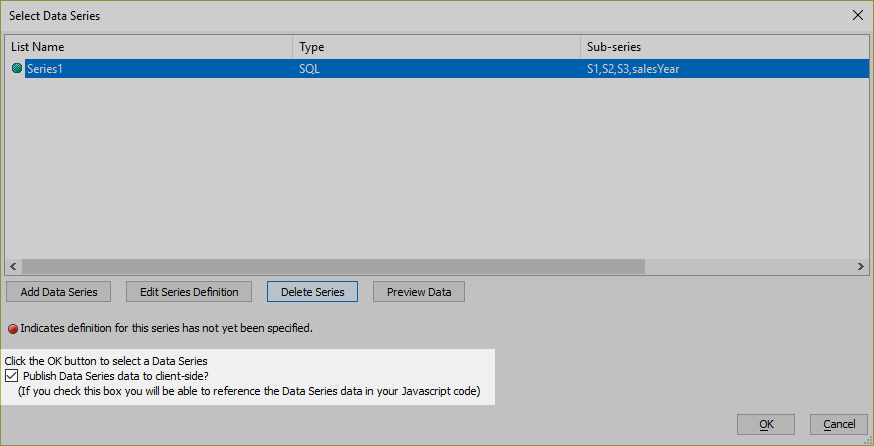
A Data Series can be populated from multiple data sources. For data stored in a SQL Database, choose the SQL data option.

To be able to use a Data Series in a Javascript Chart, it is also recommended to enable publishing Data Series client-side. Check the Publish Data Series data to client-side? checkbox. This makes the Data Series available in an offline environment.
Populating the Javascript Chart
The Data Series, Series1, is dynamically calculated from a table in a SQL Database. It contains four sub-series: S1, S2, S3, and salesYear. The sub-series can be used to populate the values in the bar chart as well as the labels for the xaxis (set by the xaxisLabels property.)
To reference the Data Series in the Javascript Chart settings, use the {dialog.object}._dataSeriesData object for the UX Component. For example, the following shows how to populate the Bar - Stacked - Animated example Javascript Chart using sub-series 'S1', 'S2', and 'S3' from the Series1 data series shown in the image above. It also shows how to dynamically set the xaxis labels using the 'salesYear' sub-series:
var _settings = function() {

    var s1 = {dialog.object}._dataSeriesData.Series1.S1;
    var s2 = {dialog.object}._dataSeriesData.Series1.S2;
    var s3 = {dialog.object}._dataSeriesData.Series1.S3;
    var _d = A5.makeArrayOfArrays(s1,s2,s3);

    //data will now be an array of arrays. for example
    //data  = [[10,4,7],[12,12,8],......]

    var settings = {
        id: '{chartDiv}',
        data: _d,
        options: {
            title: 'Stacked Bar Chart',
            titleSubtitle: '3 Data Series Shown',
            colors: ['#8EC3A7','#DC5356','#F0CB69'],

            xaxisLabels: {dialog.object}._dataSeriesData.Series1.salesYear,
            grouping: 'stacked',
            strokestyle: 'white',
            yaxisMax: 40,
            yaxisColor: 'transparent',
            yaxisUnitsPost: '',
            yaxisUnitsPre: '$',
            xaxisColor: 'transparent',
            textSize: 12,
            textColor: '#8EC3A7',
            backgroundGridVlines: false,
            backgroundGridBorder: false,
            hmargin: 10,
            gutterTop: 50,
            gutterLeft: 50,
            attribution: false
        }
    };
    return settings;
};
This gives us the following bar chart:

To learn more about client-side Data Series and how to dynamically populate Javascript Charts using data from a SQL Database, watch the videos below:
Populating a Javascript Chart with Data from a SQL Database
The data shown in a Javascript Chart can be obtained from a SQL Database. This is accomplished using a client-side Data Series
In this video, we show a simple example that demonstrates how to bind the Javascript Chart data to data from a SQL Database using a Data Series. The Data Series is populated from a SQL database and published to the client, making it available in an offline environment.
In Depth Example - Populating a Javascript Chart Using SQL Data
This example shows a pie chart with a data that is calculated doing a multi-table SQL query against the Northwind database (which ships with Alpha Anywhere.) The chart can be filtered to show data from a specific country using a dropdown box to select the country. The number of products shown are also be dynamically filtered using a dropdown box.