Adding Client-Side Charts to Your Business Intelligence Dashboards with Alpha Anywhere and the Google Chart AP

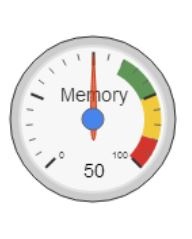
In Alpha Anywhere, the UX Component contains a powerful built-in chart control (based on the Microsoft .NET visualization library) which enables the creation of robust business intelligence dashboards fast.
This is a 'server-side' control, meaning that the chart is rendered on the server and then the resulting image is sent to the browser. However, there may be times when you want 'client-side' charting (i.e. charts that are rendered using JavaScript).
The Google Chart API is perfect for this. (Note: There are number of high quality open source JavaScript libraries that you can choose from).
In this video we show how you can use the Google Chart API to add client-side charts to your UX component-created business intelligence dashboards.
Watch the video: Part 1, Part 2
Using SQL data in a Google Chart
In previous videos we have shown ho easy it is to use Google Charts in a UX component by simply copying code from the Google Charts API documentation. However, in all of the example in the Google Chart API documentation, the data plotted by the chart is static (i.e. it is hard coded into the Javascript).Of course, in a real application, it is likely that you will want to query a SQL database to get the data to be plotted on the chart. In this video we show an example of how this can be done.
Watch Video - Part 1
Watch Video - Part 2
Watch Video - Part 3


Comment