
|
Imagine that you were like the all-knowing, all-seeing, Business Wizard of Oz. You would see everything going on in your company. You would know how each region was performing, what was happening with your competition, and how your marketing campaigns were putting your business ahead of the trends. But your magic wouldn't stop there. Imagine how your decisions would be guided if you could see and analyze data throughout the production, marketing, distribution, and sales process. Your newfound vision and wisdom would lead you to make informed decisions and would focus your energies intelligently, avoiding the pitfalls of assumption and guesswork. There's good news: you can be that wizard! But you won't accomplish these feats with the wave of a magic wand. The power behind the curtain comes from an ultimately useful tool known as Business Intelligence or Data Analytics! |

Be a Wizard of Business with Data Analytics |
What is Data Analytics?
Data Analytics includes taking data and processing it, either via filters, conditions, or algorithms and then displaying the resulting information visually. For example, analytics for your company can track just about any facet of ones business. In fact, there are so many ways that we collect and store data that it becomes easy to get lost in a sea of raw data. Data only truly becomes useful when it's meaning becomes clear and it can provide guidance for business decisions.
Fortunately, all that raw data can be shown with conditions, filters, or algorithms imposed by the user so that the raw data is processed and displayed visually in ways that make the data truly useful. But how is that accomplished? What tools can we use to make our data clear, visible and valuable?
Data Visualization via Dashboards
Dashboards display data to facilitate comparative analysis |
As stated, raw data can overwhelm, but even with filtering, the meaning of data can be obscured. What really brings meaning to data is for data sets or historical data to be displayed visually so that comparative analysis of chosen data points can be made. This data analysis, or data science, is most commonly accomplished by a data analyst or data scientist using dashboard displays that provide an accurate understanding and typically lead to better business decisions. Why is that useful to you and your business? Data analysis and data visualization can be done on just about any data that your company collects. For example, say you want to see your sales data for the past month. You could easily filter data from sales reports into a dashboard showing plots and trends for your sales, broken down across different product categories, dates, or sales teams. That is clearly useful but comparative analysis of visualized data can take you even further. Prescriptive analytics or predictive analytics makes insights even more valuable and actionable. |
Imagine now that your first filtering showed a substantial drop in sales that occurred during one week of the previous month. Further honing of your data sources and filtering could allow greater understanding. For example, You could add new tiles to your dashboard display, this time showing data of your 'sales per agent' results and your 'SEO and web conversion statistics' for that month.
At first glance, you see that your website conversions were roughly the same throughout the month, effectively eliminating that as your concern. Then when reviewing the 'sales per agent' display you see that one of your sales agents who has performed well in the past has had only one sale for the whole week.
Now you have a new concern. Is this salesperson losing focus? Are they not keeping up with their responsibilities? Maybe it's time to do some retraining or start an action plan?. But then again, data is key and only complete data tells the whole truth.
A need to better understand the situation leads you to further data analysis. Now you create another tile on the dashboard, this time showing employment records of all sales staff. When showing the per agent employment you now see that the agent in question missed 4 out of the 5 days during that week with an illness.
Now you know that this is not an employee to be let go, on the contrary, their absence causing such a dip in overall sales shows just how important they are to your team. Perhaps you might consider offering this employee a bonus or raise to inspire loyalty, or perhaps seek to better understand their health issues so you can provide the support she needs to stay engaged on the job.
And by realizing that sustained absences could affect end-of-month sales results, you could set up workflows that alert sales managers if an employee is out -- or puts in an advance request for time off - for 3 or more consecutive days. That manager can proactively work with other members of the team to fill potential gaps before the end of the quarter.
It's a pretty compelling example. And it's not just a thought exercise, this type of data accuracy and understanding via comparative analysis is essential for operating an intelligent business in today's marketplace. Every company has data, the best ones know how to use it -- not just to look back but to also look ahead.
Your Data Shown Your Way with Alpha TransForm Analytics
|
Fortunately, Alpha Software has what you need to become an all-knowing, all-seeing business wizard who has instant access to business insights, based on up-to-date, accurate data. The solution is called Alpha TransForm. and it just had a dramatic update that brings together the power of faster and better mobile data collection for front-end workers, with powerful business analytics dashboards and data integration for back-office managers. You can now speed data collection in the field by generating mobile forms that can quickly capture digital signatures, location, photos, or bar code data instantly. Then your form data can be visualized with extreme clarity with TransForm Dashboards so you can gain new business insights and make better business decisions. Using a point and click configuration, create charts, lists, or create custom visualizations from scratch to identify trends, track metrics, or capture key performance indicators. Dashboards can also be made interactive through the addition of User Inputs which can be used to refine and explore your data. |
.png?width=1723&name=tf%20analytics%201-new%20(1).png) 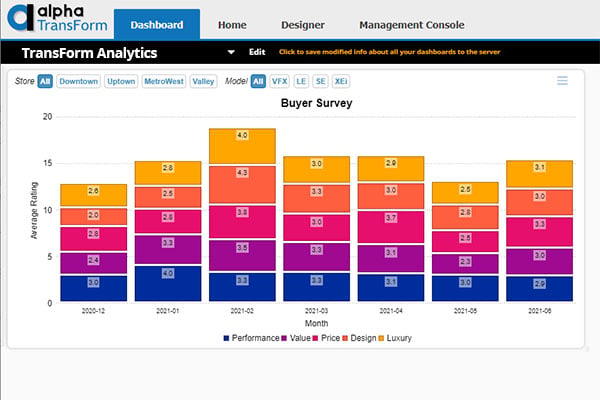
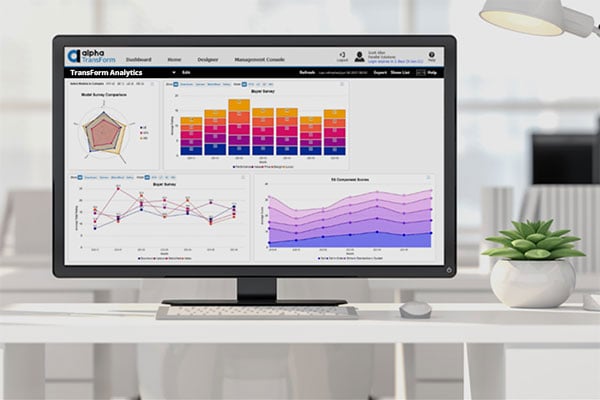
Announcing Alpha TransForm Analytics, a new way to visualize your data. |
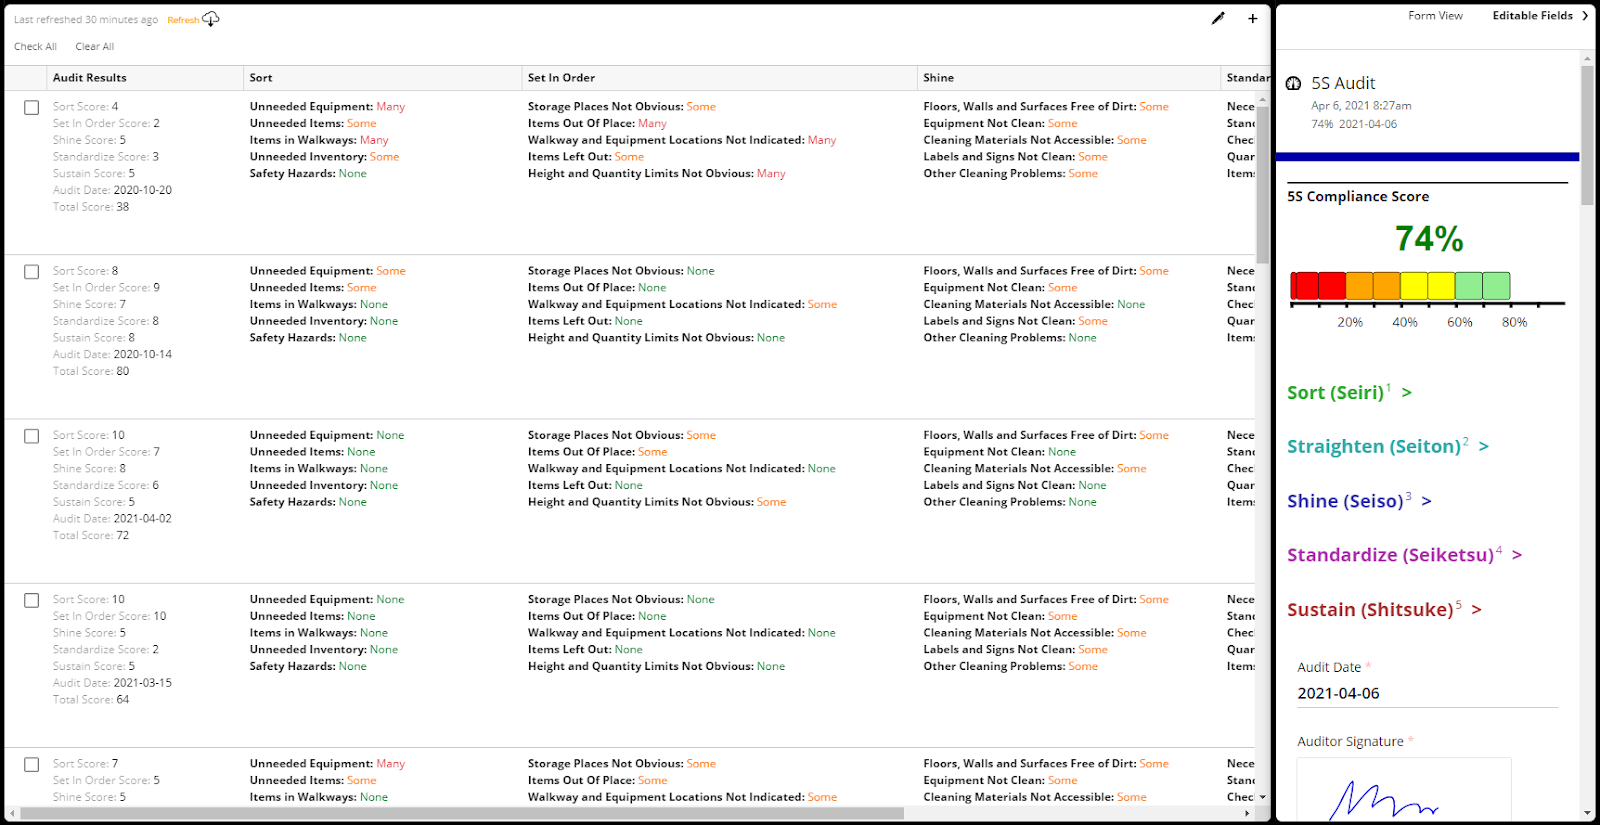
In addition to Dashboards, we've also introduced a new way to view individual forms with the new Form View report. Form View reports leverage the look and feel of the TransForm Filler app to create a user-friendly view of a form.
|
View individual forms with the new Form View report |
By using mobile forms created with Alpha Transform, administrators can automate previously manual tasks, like sending emails and SMS messages, generating and sending reports, assigning and re-assigning forms or job tickets to other workers Users that want to take the product further can use the product’s robust API to communicate with other systems. The product also includes TPL, a simple, but powerful scripting language that allows your mobile forms to access onboard databases, launch navigation apps, call out to APIs, and more. These are just some of the exciting new features of the new and improved Alpha TransForm. |

Read the Alpha TransForm Analytics release notes or download the free license app to start collecting data and building dashboards today.


Comment