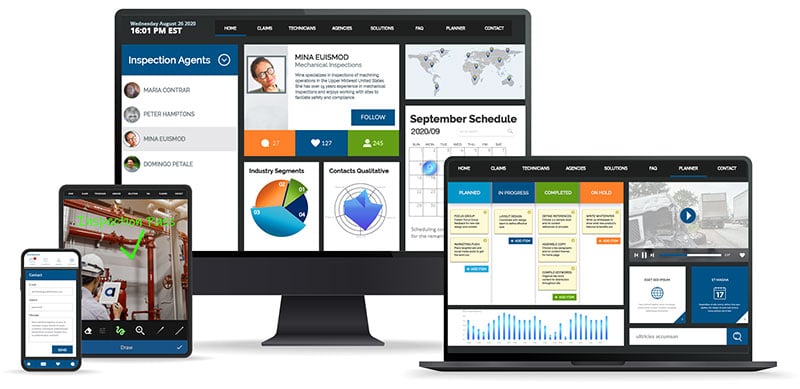
What is a low-code app builder?
Low code is a method in which developers use a visual interface and pre-coded modules to greatly reduce the amount of writing and debugging of code.
A development process that once took months now takes days or weeks with low-code. This greatly reduces risk and improves software quality. A wide range of users can turn their app ideas into enterprise apps with outstanding user experiences, often without having to write code.
Alpha Anywhere excels at creating apps that work in real-time, tie seamlessly to any data source, map to business processes, and perform well on any operating system.